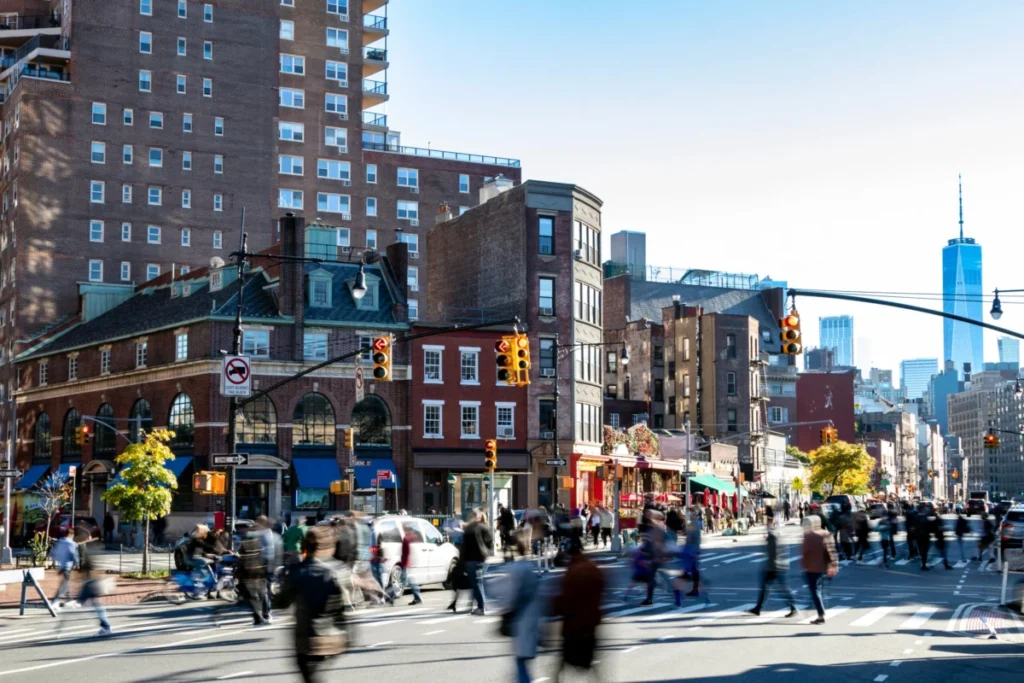
A groundbreaking study from the Massachusetts Institute of Technology (MIT) has unveiled the first comprehensive model of pedestrian activity for an entire U.S. city, offering unprecedented insights into how people navigate New York City on foot. This ambitious mapping project, detailing sidewalks, crosswalks, and footpaths across all five boroughs, promises to revolutionize urban planning by providing crucial data on pedestrian movement and safety, a realm long overshadowed by the focus on vehicular traffic. The findings, published today in the prestigious journal Nature Cities, challenge conventional wisdom about pedestrian density and highlight critical areas in need of infrastructure investment and safety enhancements.
For decades, urban planners and government officials have meticulously tracked vehicle traffic, investing heavily in road networks and traffic management systems. Pedestrian movement, however, has largely been an anecdotal measure, lacking the granular data necessary for informed decision-making. This oversight is strikingly illustrated by the iconic scene in the 1969 film "Midnight Cowboy," where Dustin Hoffman’s character, Ratso Rizzo, famously shouts, "I’m walking here!" as a taxi narrowly misses him. This cinematic moment, while fictional, captures a palpable reality: the inherent tension and potential conflict that arises when dense pedestrian and vehicular traffic intersect, a phenomenon that has been poorly quantified by urban planners.
The MIT research, led by Andres Sevtsuk, an associate professor in MIT’s Department of Urban Studies and Planning (DUSP) and head of the City Design and Development Group, aims to rectify this imbalance. "We now have a first view of foot traffic all over New York City and can check planning decisions against it," Sevtsuk stated. "New York has very high densities of foot traffic outside of its most well-known areas." The study meticulously charts pedestrian flow, revealing that while Manhattan, particularly Midtown, boasts the highest pedestrian density per block, other boroughs exhibit substantial foot traffic that may be underserved by current infrastructure investments.
Unveiling Hidden Pedestrian Hubs
The study’s findings challenge the perception that pedestrian activity is confined to Manhattan’s most famous thoroughfares. The research indicates that significant stretches of sidewalks and public spaces in Brooklyn, Queens, and the Bronx host foot-traffic levels comparable to many parts of Manhattan. This suggests a potential "Manhattan bias" in existing pedestrian infrastructure policies, with a disproportionate focus on the most visible and bustling areas, potentially at the expense of equally vital pedestrian networks elsewhere in the city.
"Midtown Manhattan has by far the most foot traffic, but we found there is a probably unintentional Manhattan bias when it comes to policies that support pedestrian infrastructure," explained Sevtsuk. "There are a whole lot of streets in New York with very high pedestrian volumes outside of Manhattan, whether in Queens or the Bronx or Brooklyn, and we’re able to show, based on data, that a lot of these streets have foot-traffic levels similar to many parts of Manhattan." This revelation is crucial for equitable urban development, prompting a reevaluation of resource allocation and planning priorities across the entire metropolitan area.
Redefining Pedestrian Safety Metrics
Beyond mapping pedestrian volumes, the MIT model introduces a critical advancement in assessing pedestrian safety. By integrating pedestrian traffic data with crash statistics, the researchers can now calculate pedestrian risk on a "per-pedestrian" basis, rather than relying solely on raw accident totals. This shift in perspective is vital for identifying truly hazardous locations.
"A lot of cities put real investments behind keeping pedestrians safe from vehicles by prioritizing dangerous locations," Sevtsuk noted. "But that’s not only where the most crashes occur. Here we are able to calculate accidents per pedestrian, the risk people face, and that broadens the picture in terms of where the most dangerous intersections for pedestrians really are." This per-pedestrian risk analysis moves beyond simply counting incidents to understanding the actual danger faced by individuals navigating the urban environment.
Rounaq Basu, an assistant professor at Georgia Tech and co-author of the study, elaborated on this point: "Places like Times Square and Herald Square in Manhattan may have numerous crashes, but they have very high pedestrian volumes, and it’s actually relatively safe to walk there. There are other parts of the city, around highway off-ramps and heavy car-infrastructure, including the relatively low-density borough of Staten Island, which turn out to have a disproportionate number of crashes per pedestrian." This nuanced understanding allows for more targeted and effective safety interventions.
The Genesis of the Model: Data and Methodology
The development of this comprehensive pedestrian model involved a sophisticated integration of various data sources and analytical techniques. The research team, including Liu Liu (PhD student at the City Form Lab in DUSP), Abdulaziz Alhassan (PhD student at MIT’s Center for Complex Engineering Systems), and Justin Kollar (PhD student at MIT’s Leventhal Center for Advanced Urbanism in DUSP), utilized existing pedestrian count data collected by the New York City Department of Transportation (DOT) in 2018 and 2019. These counts, though valuable, covered only specific segments of city sidewalks.
To bridge this data gap, the MIT team developed a predictive model capable of estimating foot traffic across the entire city. This model incorporates a wide array of factors, including land use, building density, transit stop proximity, street network characteristics, and the timing of day and week. By calibrating the model against the DOT’s observed counts, researchers could then extrapolate these estimates to cover all accessible pedestrian routes.
"Because of jobs, transit stops are the biggest generators of foot traffic in the morning peak," observed Liu Liu. "In the evening peak, of course people need to get home too, but patterns are much more varied, and people are not just returning from work or school. More social and recreational travel happens after work, whether it’s getting together with friends or running errands for family or family care trips, and that’s what the model detects too." This understanding of diurnal and weekly travel patterns is crucial for designing public spaces that cater to diverse user needs.
Quantifying the Foot Traffic Landscape
The model’s granular analysis revealed striking details about pedestrian volumes. During the evening peak hours, Midtown Manhattan emerged as the area with the highest foot traffic, averaging approximately 1,697 pedestrians per sidewalk segment per hour. The Financial District followed with 740 pedestrians per hour, and Greenwich Village ranked third with 656 pedestrians per hour.
However, the study also highlighted areas with significant, yet less recognized, pedestrian activity. Morningside Heights and East Harlem, for instance, registered around 226 and 227 pedestrians per block per hour, respectively. These figures are comparable to, or even exceed, those in certain parts of the outer boroughs. Brooklyn Heights saw an average of 277 pedestrians per hour, University Heights in the Bronx recorded 263, Borough Park in Brooklyn and the Grand Concourse in the Bronx averaged 236, and a section of Corona in Queens averaged 222 pedestrians per hour. Many other locations across the city also demonstrated foot-traffic levels exceeding 200 pedestrians per hour.
A Paradigm Shift in Urban Planning
The implications of this research extend far beyond New York City. The methodology developed by the MIT team provides a scalable framework that can be adapted and applied to urban environments across the United States and globally. This is particularly relevant as cities grapple with the urgent need to decarbonize, promote sustainable transportation, and enhance the quality of urban life.
"I hope this can inspire other cities to invest in modeling foot traffic and mapping pedestrian infrastructure as well," Sevtsuk urged. "Very few cities make plans for pedestrian mobility or examine rigorously how future developments will impact foot-traffic. But they can. Our models serve as a test bed for making future changes."
The MIT team is already collaborating with municipal officials in other major cities to implement their pedestrian modeling tools. Los Angeles, preparing for the 2028 Summer Olympics, is working with MIT to enhance pedestrian and public transit mobility for both daily commutes and the expected influx of visitors. Similarly, the state of Maine is engaging the team to assess pedestrian movement across over 140 cities and towns, aiming to identify critical areas for infrastructure upgrades and safety improvements statewide.
This initiative represents a significant departure from the 20th-century urban planning paradigm, which often prioritized the automobile. By providing robust data on pedestrian movement and safety, the MIT model empowers cities to rebalance their planning efforts, fostering more walkable, equitable, and sustainable urban futures. The ability to quantify the "invisible" pedestrian, to understand their journeys and risks, is a critical step towards creating cities that truly serve all their inhabitants.
Historical Context: The Long Shadow of the Automobile
The development of this pedestrian-centric model arrives at a pivotal moment in urban history. The mid-20th century saw a significant shift in urban design and policy, heavily influenced by the rise of the automobile. Post-World War II suburbanization, fueled by affordable cars and extensive highway construction, fundamentally reshaped American cities. Streets, once vibrant public spaces, increasingly became conduits for vehicular traffic, often at the expense of pedestrian safety and accessibility.
This car-centric approach led to the decline of traditional downtowns, the rise of sprawling suburbs, and a public health crisis linked to sedentary lifestyles and air pollution. While the environmental and health impacts of car dependency have become increasingly apparent, urban planning has often been slow to adapt, with infrastructure investments continuing to favor roads and parking. The MIT study’s emphasis on pedestrian data directly challenges this legacy, advocating for a more balanced approach that recognizes the vital role of walking in urban life.
A New Era for Urban Data and Policy
The implications of this research for urban policy are profound. City governments can now leverage this data to:
- Prioritize Infrastructure Investments: Identify areas with high pedestrian volume and significant safety risks to guide the allocation of funds for sidewalk improvements, crosswalk enhancements, and traffic calming measures.
- Evaluate Development Impacts: Assess how new construction projects or rezoning proposals might affect pedestrian circulation and safety, ensuring that development benefits rather than harms walkability.
- Enhance Public Space Design: Inform the design of parks, plazas, and streetscapes to better accommodate pedestrian needs and encourage vibrant public life.
- Improve Emergency Response: Understand pedestrian flow patterns to optimize emergency service routes and evacuation plans.
- Promote Equity: Ensure that investments in pedestrian infrastructure are distributed equitably across all neighborhoods, addressing disparities that may have arisen from historical planning biases.
The research paper, titled "Spatial Distribution of Foot-traffic in New York City and Applications for Urban Planning," is a testament to the collaborative efforts of Sevtsuk, Basu, Liu, Alhassan, and Kollar. Their work not only provides a critical new dataset for New York City but also offers a replicable blueprint for cities worldwide to understand and prioritize the needs of their walking populations, ushering in a new era of data-driven, human-centered urban planning.