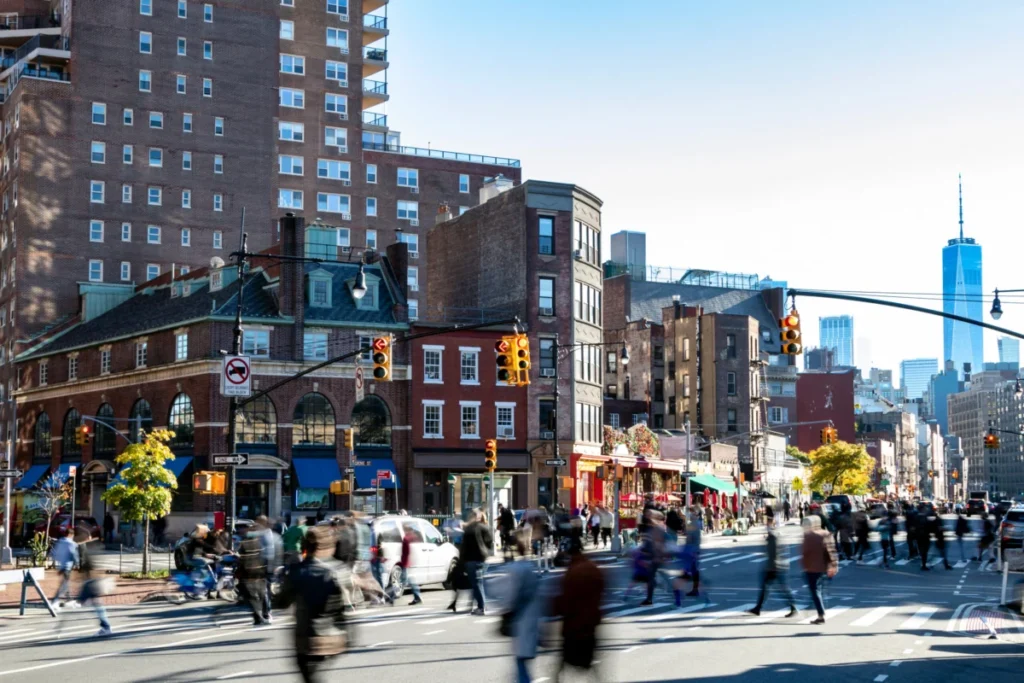
The iconic scene from the 1969 film "Midnight Cowboy," where Dustin Hoffman’s character, Ratso Rizzo, angrily bangs on the hood of an encroaching taxi and famously shouts, "I’m walking here!", encapsulates a long-standing tension in urban environments: the collision of pedestrian and vehicular traffic. For decades, city planners and governments across the United States have meticulously tracked vehicle movements, often at the expense of understanding pedestrian flow. This imbalance has left a significant gap in our comprehension of urban mobility. However, a groundbreaking initiative by a research group at the Massachusetts Institute of Technology (MIT) has begun to rectify this oversight. They have successfully assembled a comprehensive, routable dataset of sidewalks, crosswalks, and footpaths for all of New York City, creating the first complete model of pedestrian activity in any major U.S. city. This ambitious mapping project promises to revolutionize how urban spaces are designed, managed, and invested in.
This pioneering model offers city planners an unprecedented granular view of pedestrian movement, enabling them to make more informed decisions about where to allocate resources for pedestrian infrastructure and public spaces. It also provides a critical tool for assessing the potential impact of development projects on non-motorized travel. Crucially, the study highlights areas where high pedestrian volumes intersect with significant safety hazards, such as traffic crashes, thereby pinpointing locations that are most in need of urgent upgrades and safety interventions.
"We now have a first view of foot traffic all over New York City and can check planning decisions against it," stated Andres Sevtsuk, an associate professor in MIT’s Department of Urban Studies and Planning (DUSP) and the lead researcher on the study. "New York has very high densities of foot traffic outside of its most well-known areas." This finding challenges conventional wisdom, suggesting that while Manhattan’s most famous districts teem with pedestrians, other boroughs also host substantial pedestrian activity and may be underserved in terms of infrastructure investment.
Uncovering Hidden Pedestrian Hubs Beyond Manhattan
The MIT model’s analysis reveals a nuanced picture of pedestrian activity across New York City’s five boroughs. While Midtown Manhattan indeed boasts the highest foot traffic per block, the data indicates that other boroughs possess numerous streets with significant pedestrian volumes that could benefit from enhanced infrastructure. This challenges a potential, albeit unintentional, bias in policy decisions that often favor the more densely populated and heavily trafficked areas of Manhattan.
"Midtown Manhattan has by far the most foot traffic, but we found there is a probably unintentional Manhattan bias when it comes to policies that support pedestrian infrastructure," Sevtsuk explained. "There are a whole lot of streets in New York with very high pedestrian volumes outside of Manhattan, whether in Queens or the Bronx or Brooklyn, and we’re able to show, based on data, that a lot of these streets have foot-traffic levels similar to many parts of Manhattan." This revelation is a critical step toward ensuring equitable development and resource allocation across the entire metropolitan area.
Redefining Pedestrian Safety: From Totals to Risk Per Pedestrian
Beyond mapping foot traffic, the MIT model introduces a vital advancement in assessing pedestrian safety. It quantifies vehicle crashes involving pedestrians not merely by raw totals but on a per-pedestrian basis. This shift in methodology provides a more accurate understanding of the actual risk faced by individuals navigating city streets.
"A lot of cities put real investments behind keeping pedestrians safe from vehicles by prioritizing dangerous locations," Sevtsuk noted. "But that’s not only where the most crashes occur. Here we are able to calculate accidents per pedestrian, the risk people face, and that broadens the picture in terms of where the most dangerous intersections for pedestrians really are." This per-pedestrian risk assessment allows for a more targeted and effective allocation of safety resources, moving beyond simply addressing the locations with the highest number of incidents to identifying areas where individual pedestrians are statistically more vulnerable.
The findings of this research were published in the prestigious journal Nature Cities under the title, "Spatial Distribution of Foot-traffic in New York City and Applications for Urban Planning." The research team comprised Sevtsuk, the Charles and Ann Spaulding Associate Professor of Urban Science and Planning in DUSP and head of the City Design and Development Group; Rounaq Basu, an assistant professor at Georgia Tech; Liu Liu, a PhD student at the City Form Lab in DUSP; Abdulaziz Alhassan, a PhD student at MIT’s Center for Complex Engineering Systems; and Justin Kollar, a PhD student at MIT’s Leventhal Center for Advanced Urbanism in DUSP.
The Evolution of Pedestrian Data Collection
This study builds upon ongoing work by Sevtsuk and his colleagues, who have previously mapped and modeled pedestrian traffic in various global locations, including Melbourne and MIT’s own Kendall Square neighborhood. Historically, while many cities collect some pedestrian count data, it has often been fragmented and insufficient for comprehensive analysis. Furthermore, while vehicle traffic impact assessments are standard for new development proposals, the impact on pedestrians has rarely been a central consideration.
New York City, however, has shown a commitment to pedestrian issues through its Department of Transportation (DOT). Notably, approximately 41 percent of all trips within the city are made on foot, a figure that significantly outpaces the 28 percent of trips made by vehicle, likely representing the highest such ratio among major U.S. cities. To calibrate their model, the MIT team utilized pedestrian counts meticulously recorded by the New York City DOT in 2018 and 2019. These recordings covered up to 1,000 city sidewalk segments on weekdays and approximately 450 segments on weekends, providing a robust foundation for their research.
The MIT model, which incorporates a wide array of contributing factors, was rigorously tested against this real-world data. Once calibrated, its predictive capabilities allowed for the expansion of foot-traffic estimates across the entire city, extending beyond the specific points where direct observations were made.
Quantifying Foot Traffic: A Detailed Breakdown
The results of the study offer a detailed quantitative analysis of pedestrian density. In Midtown Manhattan, the model identified an average of 1,697 pedestrians per sidewalk segment per hour during the evening peak, the highest concentration in the city. The Financial District in lower Manhattan followed, with 740 pedestrians per hour, and Greenwich Village ranked third at 656 pedestrians per hour.
However, the data also revealed that other parts of Manhattan experience significantly lower pedestrian traffic. For instance, Morningside Heights and East Harlem registered between 226 and 227 pedestrians per block per hour. These figures are comparable to, or even lower than, those found in certain areas of other boroughs. Brooklyn Heights recorded 277 pedestrians per sidewalk segment per hour, while University Heights in the Bronx saw 263. Borough Park in Brooklyn and the Grand Concourse in the Bronx averaged 236 pedestrians per hour, and a segment of Corona in Queens averaged 222. Numerous other locations across the boroughs registered pedestrian volumes exceeding 200 per hour.
The model’s sophistication lies in its ability to overlay various types of pedestrian journeys for different times of the day. It reveals distinct patterns: in the morning, pedestrians are predominantly headed towards work and educational institutions. During midday and the evening, travel patterns become more diverse, as individuals engage in activities such as visiting amenities, socializing, or pursuing recreational interests.
"Because of jobs, transit stops are the biggest generators of foot traffic in the morning peak," observed Liu Liu, a PhD student involved in the research. "In the evening peak, of course people need to get home too, but patterns are much more varied, and people are not just returning from work or school. More social and recreational travel happens after work, whether it’s getting together with friends or running errands for family or family care trips, and that’s what the model detects too." This insight into the diverse motivations behind pedestrian travel is crucial for urban planning that aims to cater to a wider range of daily needs and activities.
Safety Insights: Beyond the Obvious Danger Zones
On the safety front, the model’s per-pedestrian risk analysis provides a more nuanced understanding of danger than simply looking at the total number of crashes. While areas like Times Square and Herald Square in Manhattan may experience a high number of pedestrian-involved accidents, their exceptionally high pedestrian volumes mean the risk per individual might be relatively lower.
"Places like Times Square and Herald Square in Manhattan may have numerous crashes, but they have very high pedestrian volumes, and it’s actually relatively safe to walk there," explained Rounaq Basu, a co-author of the study. "There are other parts of the city, around highway off-ramps and heavy car-infrastructure, including the relatively low-density borough of Staten Island, which turn out to have a disproportionate number of crashes per pedestrian." This finding underscores the importance of a risk-based approach to safety improvements, ensuring that resources are directed not only to areas with high absolute numbers of incidents but also to those where the individual risk is elevated.
A Scalable Model for Urban Futures
The implications of the MIT pedestrian model extend far beyond New York City. Its developers envision its widespread adoption by municipalities across the United States and beyond. The research team has already been in communication with New York City officials, who have expressed interest in incorporating the model into their policy and planning processes.
"As distinct as New York City might be, the MIT model can be applied to cities and towns anywhere in the U.S.," Sevtsuk emphasized. The team is currently collaborating with municipal officials in Los Angeles, who are not only focused on enhancing pedestrian and public transit mobility for daily commutes but are also strategizing for the anticipated influx of visitors for the 2028 Summer Olympics.
Simultaneously, the state of Maine is partnering with the MIT team to assess pedestrian movement across more than 140 of its cities and towns. This initiative aims to inform the state’s strategy for upgrading pedestrian infrastructure and enhancing safety measures statewide. Sevtsuk expresses hope that this New York City study will inspire other urban centers to embrace similar data-driven approaches to understanding and planning for pedestrian mobility.
"I hope this can inspire other cities to invest in modeling foot traffic and mapping pedestrian infrastructure as well," Sevtsuk urged. "Very few cities make plans for pedestrian mobility or examine rigorously how future developments will impact foot-traffic. But they can. Our models serve as a test bed for making future changes." This sentiment highlights a critical shift needed in urban planning: a move away from the 20th-century paradigm heavily skewed towards vehicular traffic and towards a more balanced, human-centered approach that prioritizes the needs and safety of pedestrians. The development of comprehensive pedestrian data and modeling tools represents a significant leap forward in achieving this goal, contributing to the broader imperative of decarbonizing cities and fostering more sustainable and livable urban environments.